TradingView is a powerful charting and analysis tool designed for users who want to perform technical analysis in crypto markets. It offers features such as candlestick price charts, time intervals, technical indicators, and drawing tools to visualize price trends effectively.
Gate TR provides three types of chart views:
- Original Chart
- TradingView Chart
- Depth Chart
The “TradingView” and “Depth” charts present candlestick-based price movements. The Depth Chart also visualizes buy and sell volumes from the order book. The TradingView chart provides advanced analysis tools like time interval customization, technical indicators, and drawing features.
Features on the TradingView Chart
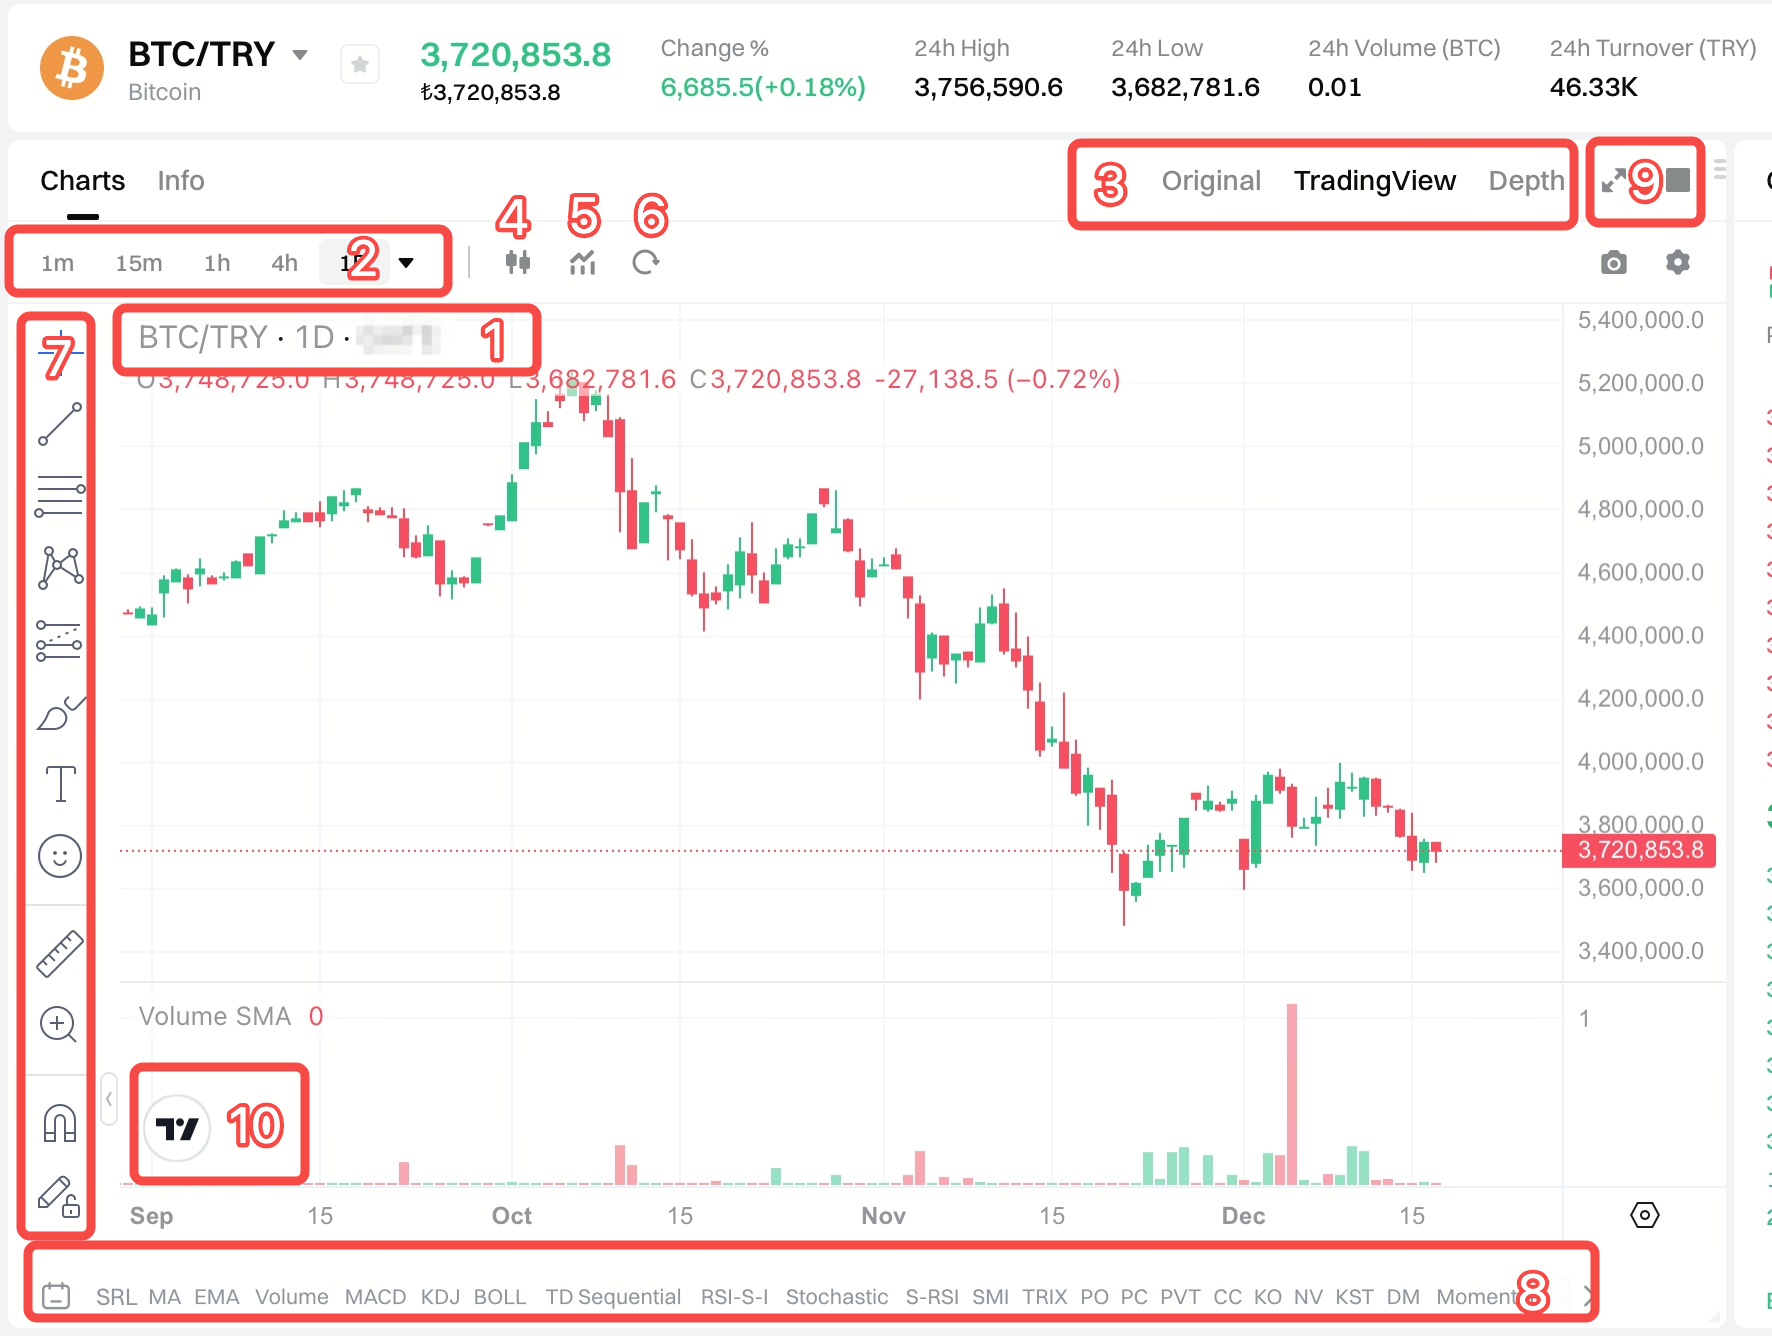
- Trading Pair Selection: Choose the trading pair you want to analyze.
- Time Intervals: Analyze price changes over 1 minute, 1 hour, 1 day, etc.
- Chart Type: Switch between Original, TradingView, or Depth views.
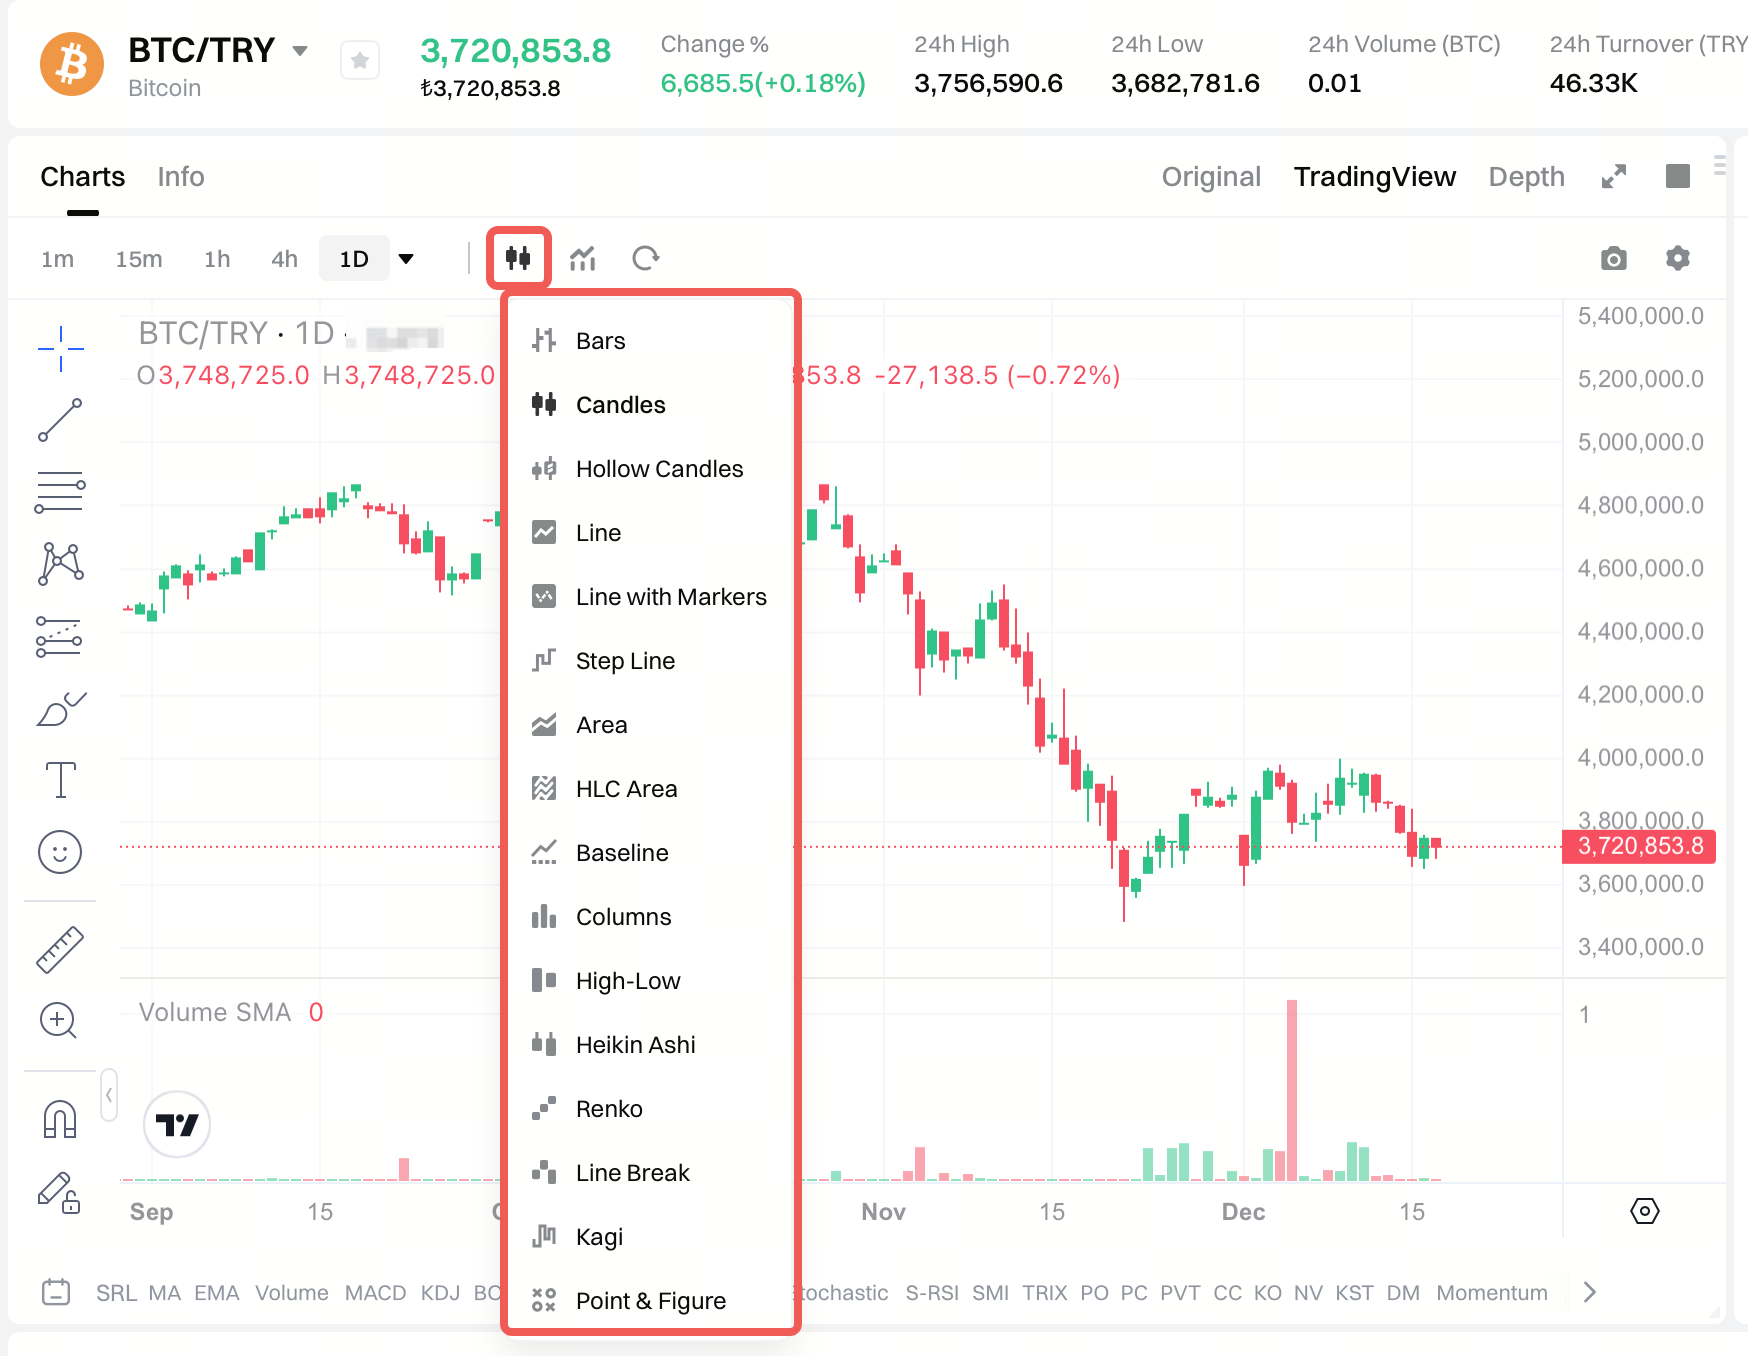
- Candlestick Style: Use line, bar, or candlestick chart formats.
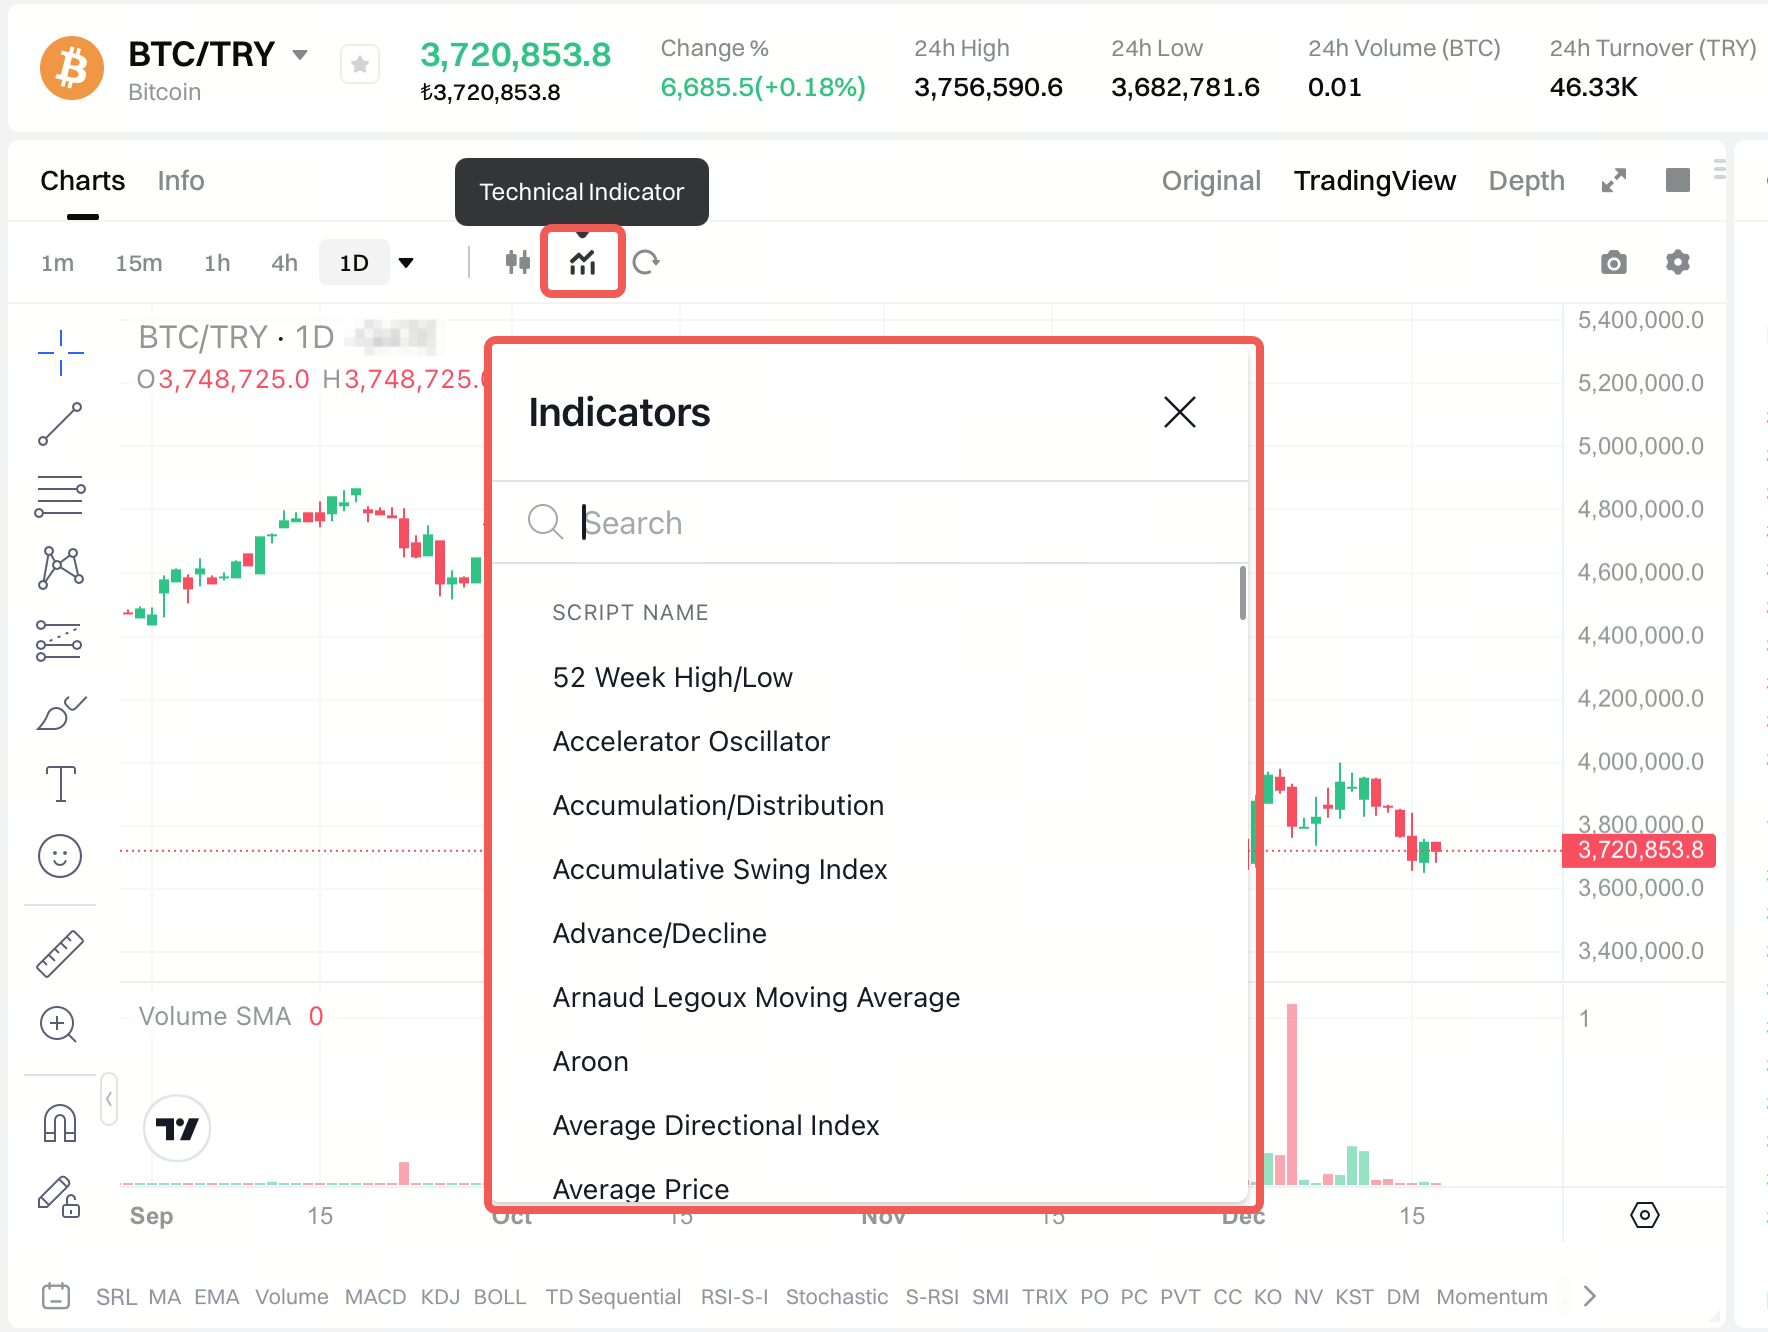
5.Technical Indicators: Add RSI, MACD, Bollinger Bands, and more.
6.Reset Chart: Clear your drawings or customizations with this option.
7.Drawing Tools: Plot trend lines, support/resistance zones, Fibonacci levels.
8.Sub-Chart Indicators: Show volume and other indicators below the main chart.
9.Full Screen & Multi-View: Expand the chart or view multiple charts simultaneously.
10.Access to TradingView Website: Click the button to go directly to TradingView’s official site.
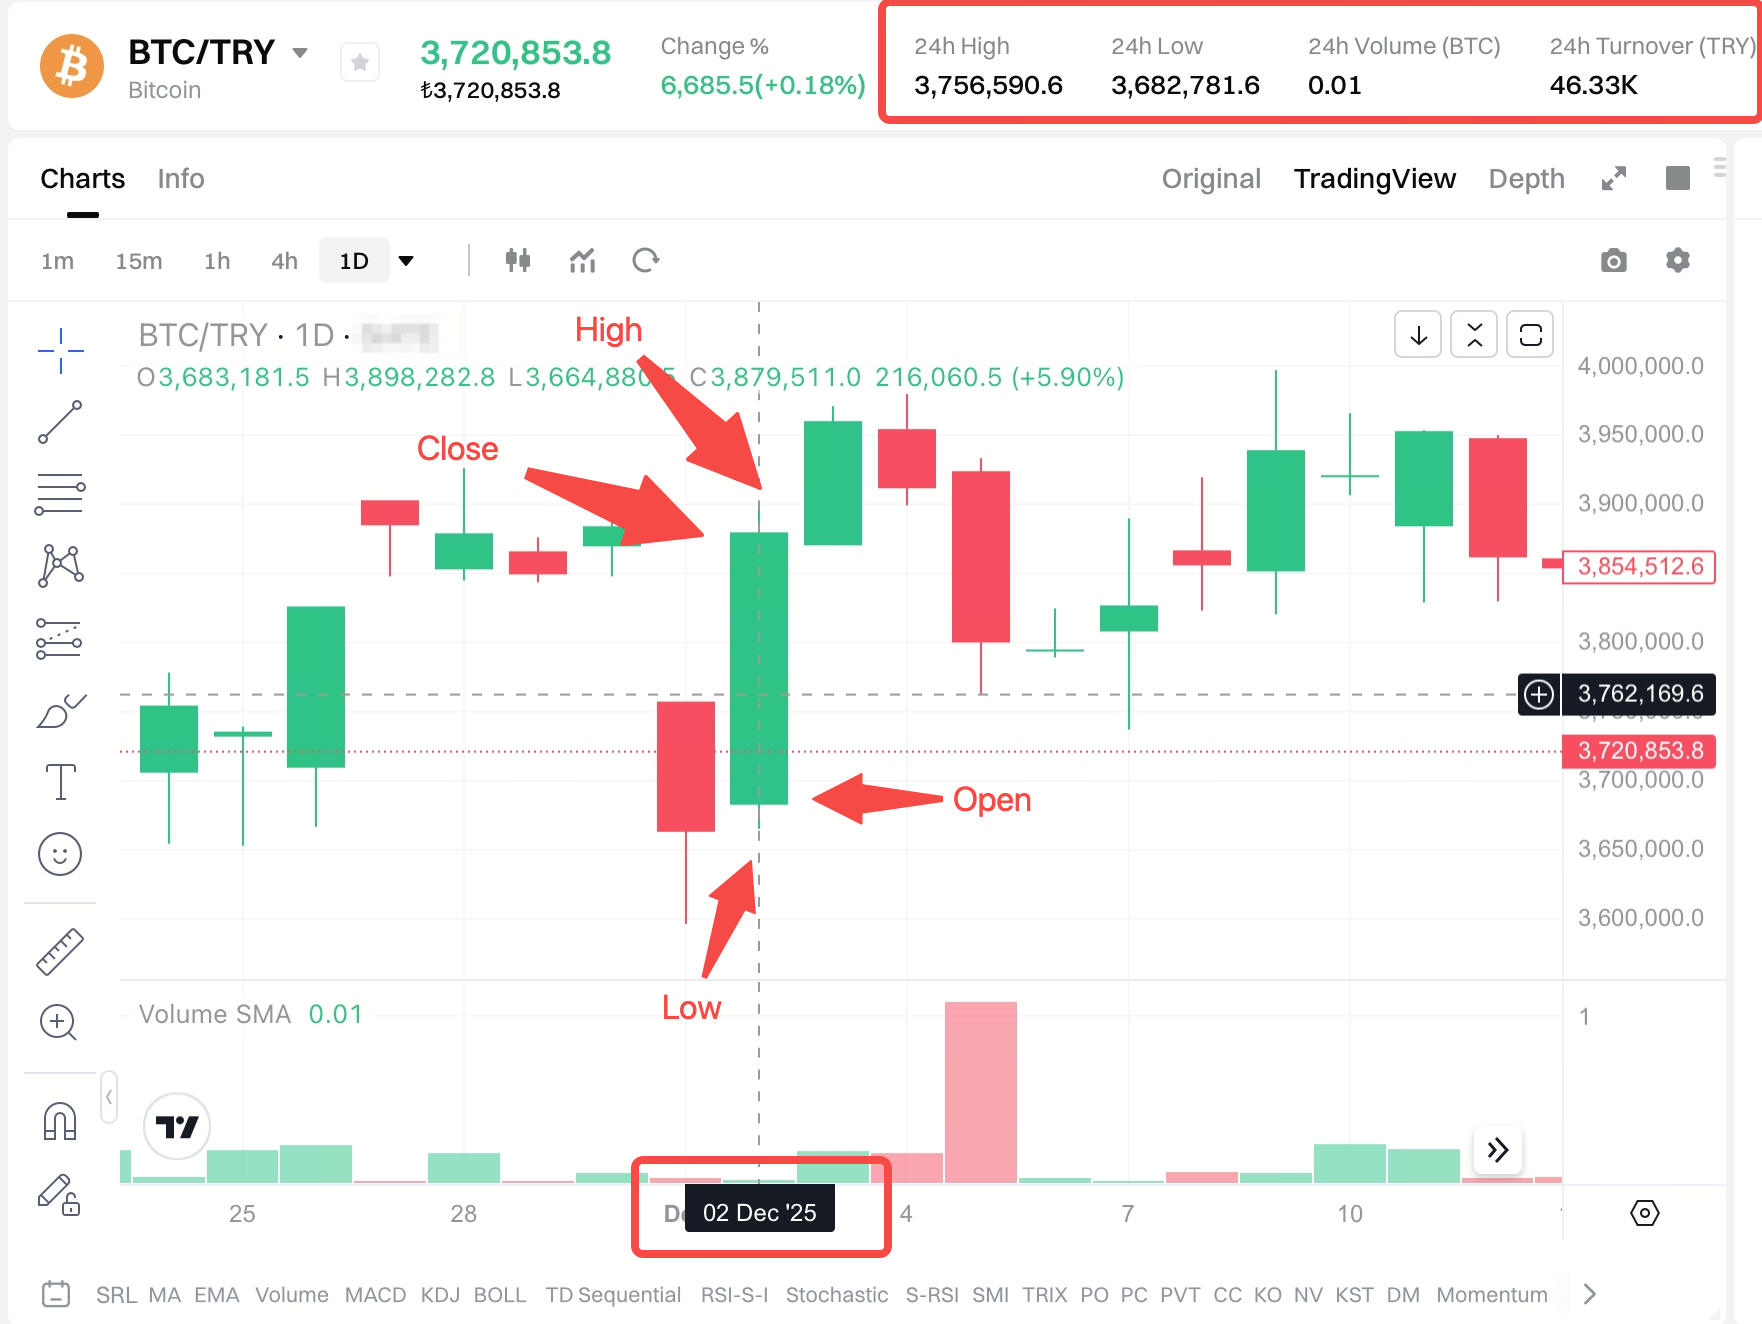
What Is a Candlestick Chart?
A candlestick chart displays an asset’s open, close, high, and low prices over a selected time interval. It’s commonly used across crypto, stock, commodities, and futures markets.
- Opening Price: Price at the start of the time interval
- Closing Price: Price at the end of the time interval
- High Price: Highest price within the interval
- Low Price: Lowest price within the interval
If the closing price is higher than the opening, the candle is usually green (or white), indicating a rise. If lower, it appears red (or black), indicating a decline.
For example, a candlestick for on December 28, 2025, would display these four price points and its color next to the trading pair's name.
For any issues, feel free to contact destek@gate.com.tr. You can also use the Gate TR app: go to your profile and tap the microphone icon in the top right to reach the Help Center and speak with a support agent.
You can also submit feedback through our Suggestions & Feedback page to win rewards!
